Module 4- Color Choropleth
This week's module dealt with Choropleth mapping and color theory. Not being an artist, this was somewhat intense and thought-provoking. Our lab was great in walking you through the process of selecting the right color theme for a map.
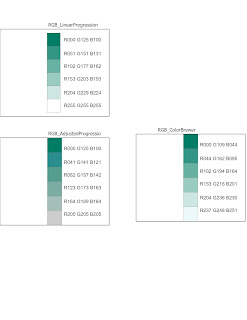
First, we covered some exercises in color ramp progressions. Below is an example displaying three varying gradients using the same base dark green hue. Original intervals: 51, 26, 31. In the Adjusted Progression, I reduced the previous intervals by -10 and added the values to each new set of RGB values. This appeared to make the hues above a shade darker. The adjusted progression is noticeably a shade darker in hue than both linear progression and ColorBrewer. ColorBrewer is also slightly more green, you can notice this change on the lightest color. I’m unsure what the formula used to produce those hues is, but they exhibit a bit more saturation within the hue.
For the main lab exercise, we had to create a map displaying the change in the county population for a state of our choice. I went with Colorado. First, I had to create a new field to reflect the population difference. Values for this new field were created via Field Calculator using a formula to calculate the difference in years and the percentage to ultimately display which counties in the state of Colorado observed significant population shifts. I chose to go with 6 classes to account for any huge gaps in low percentages. For the method, I chose Quantile so as to distribute the data equally among all classes. As a means to avoid confusion, I reduced the number of decimal places to 1, chose to display Percentage in the legend, used NAD 1983 2011 State Plane Colorado North FIPS 0501 projected coordinate system to account for the state's size and modified the color ramp to go from most to least amount of population growth. As for the overall color theme, I tried to utilize colors in the Colorado state flag.


Comments
Post a Comment