GIS5935 Week 1-- Data Quality: Fundamentals
For our first lab in Special Topics in GIS we looked at what accuracy and error mean in the context of Data Quality.
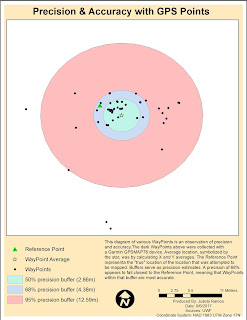
In this first part of the lab I calculated the average WayPoint based off WayPoints gathered from a Garmin GPSMAP76 unit in order to find the precision of a specific location. Average location was determined by calculating X and Y averages. In the diagram below, the Reference Point represents a the "true" location of the location that was attempted to be mapped. Buffers of 50%, 68% and 95% precision were also calculated to observe the precision of the data.
For the second part of the lab, we had to calculate error metrics for another and larger set of GPS points and create a Cumulative Distribution Function graph showing the error distribution for all metrics.


Comments
Post a Comment