Module 6- Data Classification

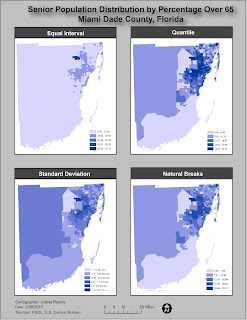
This week we explored different data classification methods and basic procedures to classify data. We were provided with data from the U.S. Census Bureau 2010 Census Tracts for the state of Florida, in Miami Dade County. With this data from the FGDL , we were tasked with classifying it based on percentage of population above 65 years of age and population above 65 years per square mile. For the lab, we had to apply the provided Census data to four different classification methods: Equal Interval, Quantile, Standard Deviation, and Natural Breaks. Below is 1 of 2 maps required for this assignment. This map focuses on displaying the senior population distribution in Miami Dade County, FL by percentage over 65. Each method used 5 classes and data was rounded to two decimal places. Due to color hues playing a significant visual part in this exercise, I decided to remove the borders from each class to better display the distributions.


