Posts

Module 6- Proportional Bivariate
Image
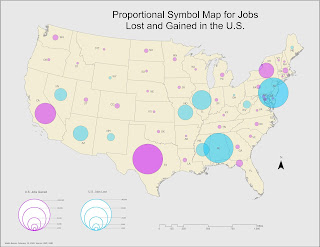
This last module dealt with proportional bivariate mapping methods. Below is a proportional map reflecting negative and positive values for the increase and decrease in the number of jobs across the U.S. We had to convert the negative values into positive values for this purpose, which allowed to symbolize is proportional to the positive values for comparison. I selected a light bright blue hue to represent the loss of jobs and a warmer purple hue to represent jobs gained. For this particular symbology need, the challenge was not so much the quantity of the values I wanted to communicate. The challenge was finding a balance and gain a better understanding of how to use color themes for that purpose. Initially, I had considered using red and blue (as in hot and cold), but it felt too political and not related to the subject matter. The main exercise for this module demanded that we create a bivariate map displaying the relationship between obesity and physical inactivity perc

Module 5- Analytics

Image
Now that we've developed a basic comprehension of color themes, labeling, and typography. This week we dived into creating an infographic using data based on the County Health Rankings data from 2018. This is my very first attempt at an infographic, I don’t think it turned out very well. But I learned a lot overall on how to think more artistically, which is not common. I thought about color themes, placement of data, and amount of information to include and in what format (chart, text, map?). It gave me a lot of ideas on how to tackle the next infographic. Another thing I considered was visual balance by seeing how things looked like when aligned with certain ways and combinations. Given more time and tools on this assignment, I would take advantage of software such as Photoshop to include a fun background that compliments the information supplied via ArcGIS Pro.

Module 4- Color Choropleth

Image
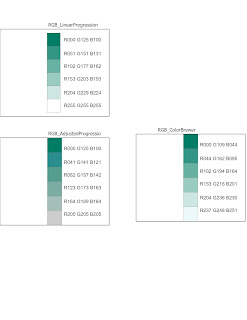
This week's module dealt with Choropleth mapping and color theory. Not being an artist, this was somewhat intense and thought-provoking. Our lab was great in walking you through the process of selecting the right color theme for a map. First, we covered some exercises in color ramp progressions. Below is an example displaying three varying gradients using the same base dark green hue. Original intervals: 51, 26, 31. In the Adjusted Progression, I reduced the previous intervals by -10 and added the values to each new set of RGB values. This appeared to make the hues above a shade darker. The adjusted progression is noticeably a shade darker in hue than both linear progression and ColorBrewer. ColorBrewer is also slightly more green, you can notice this change on the lightest color. I’m unsure what the formula used to produce those hues is, but they exhibit a bit more saturation within the hue. For the main lab exercise, we had to create a map displaying the change in the cou

Module 3- Terrain Visualization

Image
In this week's module, we covered various terrain visualization techniques, including contour lines, hillshade manipulation, and the use of digital elevation models (DEM) on a 2-dimensional surface. The main exercise required to overlay a land cover layer of Yellowstone over an elevation raster layer. Seen below is my final result. On the left is land cover, with some transparency, over a traditional hillshade effect. I selected a traditional effect because it best represented land cover features. On the right is the elevation with a multispectral hillshade effect.  I went through a few color ramps to test which best complemented this DEM's physical features. I also went ahead and grouped many of the original land cover features into Pine Trees, Douglas Firs, etc. in order to generalize the different types of tree types. As for the map layout, at first I only had a single map frame and tested ways to represent elevation alongside land cover since I would otherwise have to mak

Module 2- Coordinate Systems

Image
Our second module dealt with coordinate systems, their development throughout history, and why they matter. I really enjoyed reading through this module's discussion since our discussion leaders selected unique coordinate systems to analyze. Antarctica's preferred coordinate system was interesting to consider since it's such a unique location. We are used to seeing maps in Mercator projection, which distorts all landforms to form a flat frame. It great learning more about how that projection works. Canada in the Lambert Conformal Conic projection For the lab, we went through a series of different minor exercises to view and apply various coordinate systems and projections in ArcPro in order to grasp a better understanding of each distortion and best uses. Lastly, the main exercise had us apply a ‘graticule’ in geographic coordinates and a measured grid in projected coordinates for a state in the U.S. I selected the state of Colorado as it’s one of my favorite st

Module 1- Map Design & Typography

Image
This first module served as a great refresher for key concepts in map design and typography. Admittedly, in day to day practice, I use ArcMap 99% of the time. Using ArcPro instead for this course has definitely been a welcome crash course on any and all updates to many familiar tools and features. The lab required to go through the process of compiling a simple map of Travis County, Texas, without labels for now, and develop a comprehensive understanding of what goes behind our own reasoning for certain design choices. In retrospect, I think there's a better way to symbolize Golf Course areas as they're not very prominent in the final map below. I would also modify the major roads symbology to be slightly thinner, and provide a faded drop shadow effect to the county shape so it does no feel flat.

GIS5100 Week10: Final Project

Image
My final project was dedicated to finding suitable areas for a new Elementary School site in Riverside County, California. I started out by compiling 5 pieces of key datasets: County Assessor parcel data, California Schools, Fault zones, Roads, and Public sites. First I performed euclidean distance analyses on four of them in order to produce zonal raster for preferred areas. A weighted analysis based on prioritizing safety shows that ideal areas fall within Hemet, Menifee, and Palm Springs Unified School Districts. Final analysis results show how active school sites are distributed, where all vacant parcels of at least 5 Acres or more lie, and recommended areas for a new school site. The two circled were determined to be the most suitable after analyzing results from weighted overlay analyses and locations of parcels. Additional setbacks are anticipated as more conditions are implemented to the list of mandatory criteria needed to finalize parcels. Looking b

GIS5100 Week9: Planning-- GIS for Local Government

Image
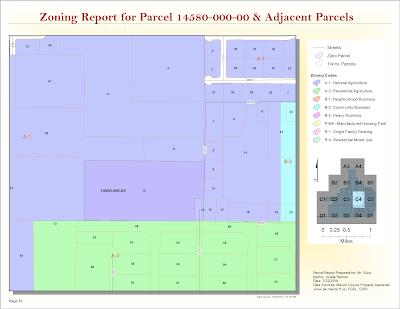
For this last module, we were given a parcel number to create a parcel report for a specific site in Marion County, Florida and its adjacent parcels. I prepared a map book using Data Driven Pages for this request using parcel data driven pages in PDF format. The map below is one page from it which displays the parcel in question. I learned all about creating and editing a parcel report to deliver to the fictional client in this scenario, Mr. Zuko. The map book feature in ArcGIS is a fantastic tool, I learned. The zoning report above was completed using data directly from the Marion County property appraiser's site and Marion County's  Land Development Code site . Part two of this lab required to identify suitable parcels for Gulf County's Board of County Commissioners (BOCC) new extension office. It required learning some advanced parcel editing methods such as creating a custom parcel based on the following client specifications: Begin at the Northeast Corner 

GIS5100 Week 8-9: Planning-- Participation Activity

Image
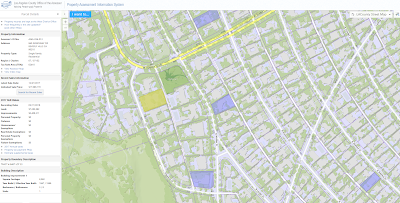
As part of our section in Planning, we completed this additional exercise in learning where to search for local parcel data in our city and what type of information is necessary to conduct a parcel report. There are a few property appraisers in Los Angeles County, it seems. This one offered some free map data services  here . While did not provide a filter to narrow down highest priced properties by year. I did find a property that sold for 17 million last year in the Beverly Hills area. The current assessed land value is $7,263,892. No previous sale price is included in this assessment. While there's limited information about recently sold properties, there is an assessor's map for this property  here . It was interesting to learn that the County updates Parcel data on this site once a year in late July once the Assessor’s Roll Release is complete. This site is fairly limited, all things said. For example, I am unable to view much data about other nearby parcels t