GIS5935 Module 13-- Effects of Scale
This was the first week addressing the topic of scale. The lab objective was to observe the effects of scale and resolution in spatial data properties for vector and raster data.
First part of the lab required me to analyze differences in scale for hydrology features.
Second, I had to compare two digital elevation models (DEMs), Lidar and SRTM, and figure out a method for comparing elevation data.
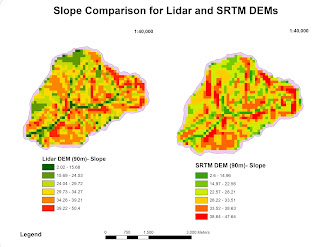
I performed Slope, Aspect and Curvature analysis on the Lidar DEM at a resolution of 90m. Then performed Slope, Aspect, and Curvature analysis on the reprojected SRTM DEM also at 90m. This data allowed me to produce a chart listing averages for both DEMs in order to observe any trends.
Notable inconsistencies were found in Average Slope degrees and Max elevation between the two DEMs. SRTM DEM had a lower measure at 29.4 average slope degrees, while the Lidar DEM was 31.3. Maximum elevation was higher for the Lidar DEM at 1063.05 than the SRTM DEM at 1053.
Which produced the following raster images for Slope, Aspect, and Curvature:


Comments
Post a Comment