Posts

Showing posts from 2018

GIS5100 Week10: Final Project

Image
My final project was dedicated to finding suitable areas for a new Elementary School site in Riverside County, California. I started out by compiling 5 pieces of key datasets: County Assessor parcel data, California Schools, Fault zones, Roads, and Public sites. First I performed euclidean distance analyses on four of them in order to produce zonal raster for preferred areas. A weighted analysis based on prioritizing safety shows that ideal areas fall within Hemet, Menifee, and Palm Springs Unified School Districts. Final analysis results show how active school sites are distributed, where all vacant parcels of at least 5 Acres or more lie, and recommended areas for a new school site. The two circled were determined to be the most suitable after analyzing results from weighted overlay analyses and locations of parcels. Additional setbacks are anticipated as more conditions are implemented to the list of mandatory criteria needed to finalize parcels. Looking b...
GIS5100 Week9: Planning-- GIS for Local Government

Image
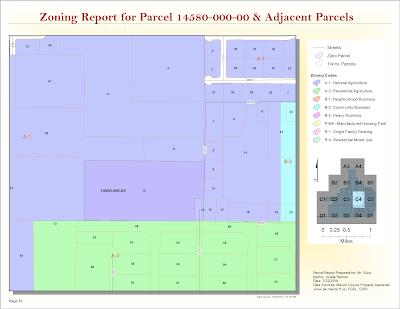
For this last module, we were given a parcel number to create a parcel report for a specific site in Marion County, Florida and its adjacent parcels. I prepared a map book using Data Driven Pages for this request using parcel data driven pages in PDF format. The map below is one page from it which displays the parcel in question. I learned all about creating and editing a parcel report to deliver to the fictional client in this scenario, Mr. Zuko. The map book feature in ArcGIS is a fantastic tool, I learned. The zoning report above was completed using data directly from the Marion County property appraiser's site and Marion County's  Land Development Code site . Part two of this lab required to identify suitable parcels for Gulf County's Board of County Commissioners (BOCC) new extension office. It required learning some advanced parcel editing methods such as creating a custom parcel based on the following client specifications: Begin at the Northeast Corner ...

GIS5100 Week 8-9: Planning-- Participation Activity

Image
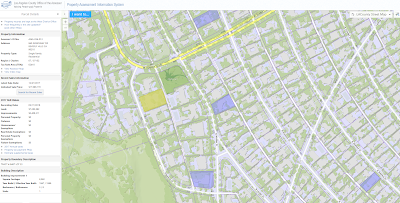
As part of our section in Planning, we completed this additional exercise in learning where to search for local parcel data in our city and what type of information is necessary to conduct a parcel report. There are a few property appraisers in Los Angeles County, it seems. This one offered some free map data services  here . While did not provide a filter to narrow down highest priced properties by year. I did find a property that sold for 17 million last year in the Beverly Hills area. The current assessed land value is $7,263,892. No previous sale price is included in this assessment. While there's limited information about recently sold properties, there is an assessor's map for this property  here . It was interesting to learn that the County updates Parcel data on this site once a year in late July once the Assessor’s Roll Release is complete. This site is fairly limited, all things said. For example, I am unable to view much data about other nearby parcels ...

GIS5100 Week8: Planning-- Location Decisions

Image
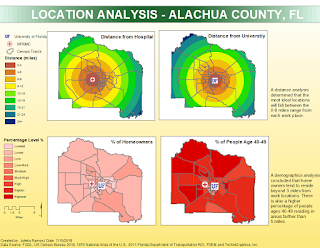
This week we were introduced to urban planning. The lab assignment required 2 location analysis maps in order to help a professional couple find suitable suggestions on where to live in Alachua County, Florida. This hypothetical couple consists of a cardiologist that works at the North Florida Regional Medical Center, and a professor looking to work at the University of Florida. Their priorities are as follows: Close to the NF RMC Close to University of Florida A neighborhood with high percentage of people ages 40-49 A neighborhood with high property values I was able to perform a location analysis for all 4 desired criteria in the map below. This analysis determined that the most ideal areas will fall between 0-9 miles from their work places. A second analysis was done doing weighted overlays based on criteria importance. The first map on the left shows an overlay in which all 4 criteria have 25% weight. The second on the right favors distances from work with an 80...

GIS5100 Week7: Homeland Security-- Protect Critical Infrastructure

Image
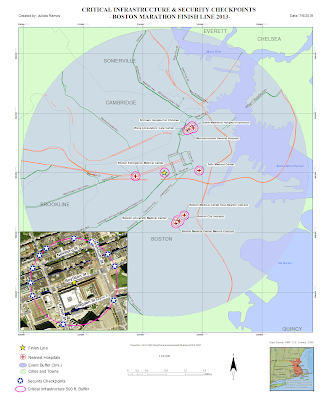
This lab marks the last week for Home Land Security. Last week we were introduced to an organizational standard for a HLS Geodatabase consisting of 7 group layers covering essential data sets in a HLS scenario for the Boston Marathon bombing in 2013. This week we put those data sets to use to produce a scenario map for critical infrastructure and a second map for site surveillance locations around critical infrastructure. This first map contains information which local towns/cities, and buildings are located within 3 mile radius from the Finish Line. Using Census data, I was able to narrow down a list of nearest hospitals, the closest one being Boston Emergency Medical Center. There were a total of 49 hospitals, 2 dams, 7 airports, and 213 schools-- all of these are considered critical infrastructures. Using Road CFCC code data, I then identified ingress and egress routes within 500 ft. from the Finish Line. These routes would be used to closely monitor suspicious activity as people...

GIS5100 Week6: Homeland Security--Prepare Minimum Essential Data Sets

Image
This week we were introduced to MEDS, which stands for Minimum Essential Data Sets. It is a series of minimal essential data sets are critical to the success of a HLS operation.   It consists of the following 8 minimal data sets: Ortho imagery Elevation Hydrography Transportation Boundaries Structures Land cover Geographic Names Due to the data used being critical to safety operations, there are minimal goals for resolution, accuracy, and currency in place for both Urban and Large areas.  For our lab this week, I prepared a MEDS GIS that helps identify key data sets to prepare for a Boston Marathon bombing crisis scenario. Started by organizing a new map based on a Boston Geodatabase. Then created 7 different group layers to include ortho imagery, DEMs, geographic names, transportation, hydrology, boundaries, structures, and land cover data. Given a specific study area helped identify only the Boston Counties affected along with geographic sites...

GIS5100 Week5: Homeland Security-- D.C. Crime

Image
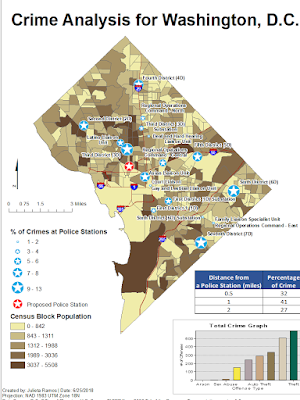
This week we start look at how GIS is used for solving homeland security and law enforcement decisions. This first assignment focuses on how crime is analyzed and managed using GIS by performing a crime analysis for Washington D.C. using data from the DC Metropolitan Police Department . For the first map deliverable, I Geocoded Police Stations from table data in order to create a point shape file for a Police Stations layer. Using a Distance Buffer and Spatial Join for Crime proximity, I was able to determine that higher populated areas do not necessarily mean higher crime rate. However, for some reason, there’s more crimes committed closer to Police stations. A majority of crime tends to occur within 1 mile of Police Stations according to the pattern displayed. Police stations are displayed by percentage of crime activity. The Police Stations with the highest crime percentages are Sixth District (6D), Seventh District (7D), and Third District (3D). 6D observes a lot of theft type ...

GIS5100 Week4: Natural Hazards-- Hurricanes

Image
This week's assignment closes our section in natural hazards with Hurricane Sandy. Using data from NOAA, FEMA, and state of New Jersey I was able to first map Hurricane Sandy's path then take a closer look at the damage caused in Ocean County, NJ. The map below was created using table data detailing storm information to create a storm path, which was them symbolized to display how it changed from start to end. I also performed a Storm Damage Assessment using NOAA, FEMA, and state of New Jersey data. The most important step for this assessment was putting together two raster mosaics, one pre-storm and one post-storm, of aerial imagery for the study area. I was able to create a chart of damage done to one side of Fort Ave using the two mosaics and ArcGIS's Effects tool.

GIS5100 Week3: Natural Hazards-- Tsunamis

Image
This week's lab had us create an evacuation map for the tsunami in Fukushima, Japan. Part of it also served as refresher in best practices for setting up a new Geodatabase using only base data files. Which meant I had to organize different feature classes into feature datasets to improve productivity. There is a lot of data involved for a natural disaster scenario and it drove home the importance of maintaining specific feature datasets within the geodatabase. One of my favorite steps in this lab involved the Fukushima and Sendai area DEMs that helped generate Evacuation Zones 1-3, not pictured in the final map in order to create a final affected coastal zone DEM. I had never created a model as large as the one for this step in model builder, it certainly saved a lot of time. What I've taken away from this scenario is that whichever method of risk assessment is used, the GIS specialist has to be prepared with the data organized and ready to present during an emergency in o...

GIS5100 Week2: Natural Hazards-- Lahars

Image
For our first lab of this course we had to identify potential hazard zones for the Mt. Hood area in Oregon.  I was able to create a final stream feature using tools in the  Spatial Analyst Extension in ArcGIS, a 2011 USGS 30M DEM of the region, census block group data, and hydrology data. To do this, I had to convert a number of rasters using the original hydrology data and DEM to determine a flow. Then, using the census block data, I was able to determine which block groups were in hazardous areas based on whether they intersected the hazard stream at .5 a mile buffer. The final result is a population analysis for areas within hazard zones. As one can see, there is a strong concentration of people, cities, and schools Southwest of Mt. Hood.

GIS Portfolio

After completing this GIS Internship course, I'll have one more course in order to complete my certification this summer. It's a great time to setup a portfolio to best showcase what I've learned and accomplished during this program and hopefully receive feedback from peers. It was a very daunting assignment when starting out. It required going back through my student blog to review which assignments I felt strongly about the most. I wound up testing different formats, menu order, and ways to implement numerous map assignments. Alas, my current final GIS portfolio can be found at  http://julieta-gis.net/ I decided to go with the digital option due to the amount of content and also because I wanted a chance to refresh my website making and modifying skills. A great benefit to using a site is that you can continue to add any sort of content in your portfolio section. This turned out to be a great assignment. Whether a peer made a paper or digital portfolio, this is some...