GIS5100 Week5: Homeland Security-- D.C. Crime
This week we start look at how GIS is used for solving homeland security and law enforcement decisions. This first assignment focuses on how crime is analyzed and managed using GIS by performing a crime analysis for Washington D.C. using data from the DC Metropolitan Police Department.
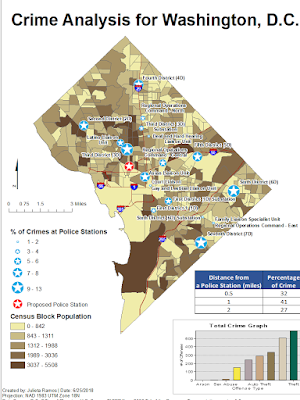
For the first map deliverable, I Geocoded Police Stations from table data in order to create a point shape file for a Police Stations layer. Using a Distance Buffer and Spatial Join for Crime proximity, I was able to determine that higher populated areas do not necessarily mean higher crime rate. However, for some reason, there’s more crimes committed closer to Police stations. A majority of crime tends to occur within 1 mile of Police Stations according to the pattern displayed.
Police stations are displayed by percentage of crime activity. The Police Stations with the highest crime percentages are Sixth District (6D), Seventh District (7D), and Third District (3D). 6D observes a lot of theft type crimes possibly due to being in a political and tourist hot spot. 7D and 3D stations appear to be in areas that observe more nefarious type of crimes such as Homicides and Sex abuse.
For my proposed new station location, I based it on crime density in that zone. It’s situated between two stations that already get a lot of activity and figured it would be a useful location. It falls within areas with a high number of burglaries. Other crimes include: Assault with a Deadly Weapon, Arson, Burglaries, Robberies, Sex Abuse, Auto Theft, Theft, and Theft from Auto. In short, A LOT of theft type incidents.

The second map deliverable for this lab involved looking at the distribution of specific crimes throughout D.C., specifically Burglaries, Homicides, and Sex Abuse. It was interesting to see how Homicides and Sexual Abuse crimes were concentrated away from central locations. Which makes sense for the perps that do not want to get easily caught. Burglaries generally appeared to be all over the place. However, there is a strong concentration surrounding tourist hot spots.


Comments
Post a Comment