GIS5935 Module 15-- Dasymetric Mapping
For this last module, we explored methods in Dasymetric Mapping.
Dasymetric Mapping is "the process of disaggregating spatial data into finer units of analysis using ancillary data to help refine locations of population of another phenomena." This type of analysis basically helps look at where populations of a certain demographic(s) are concentrated within a set of boundaries. It may sounds like a fairly straight forward process, but it turned out more complex than expected...
The first two parts of the lab were great exercises and stepping stones, per se, in introducing us to the process and mind set of actually perform a dasymetric analysis. First I performed an Areal Weighting analysis that required to produce a population estimate for areas within a Basin. This was followed by another Areal Weighting exercise this time with ancillary data which produced a population estimate for children within certain school districts.
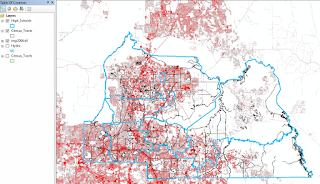
I will admit that the last part got the best of me while attempting to solve. Using populations from the previous exercise, I had to allocate those numbers to line up with a raster of imperviousness in order to get a rough estimate, a more precise one this time, for populations of children in certain school districts. While my methodology took a rough turn, I was able to produce a map displaying school district boundaries (in blue), Census Tract areas (black lines), and raster of imperviousness. The areas with higher populations are in red.


Comments
Post a Comment