Module 3- Terrain Visualization
In this week's module, we covered various terrain visualization techniques, including contour lines, hillshade manipulation, and the use of digital elevation models (DEM) on a 2-dimensional surface.
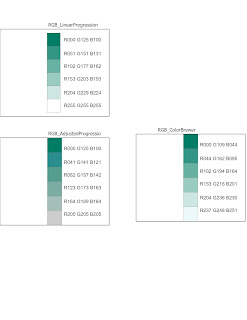
The main exercise required to overlay a land cover layer of Yellowstone over an elevation raster layer. Seen below is my final result. On the left is land cover, with some transparency, over a traditional hillshade effect. I selected a traditional effect because it best represented land cover features. On the right is the elevation with a multispectral hillshade effect. I went through a few color ramps to test which best complemented this DEM's physical features. I also went ahead and grouped many of the original land cover features into Pine Trees, Douglas Firs, etc. in order to generalize the different types of tree types. As for the map layout, at first I only had a single map frame and tested ways to represent elevation alongside land cover since I would otherwise have to make the land cover layer very transparent to notice any hillshade effects. Ultimately came to the conclusion that I needed two different map frames depicting the information I wanted.
The main exercise required to overlay a land cover layer of Yellowstone over an elevation raster layer. Seen below is my final result. On the left is land cover, with some transparency, over a traditional hillshade effect. I selected a traditional effect because it best represented land cover features. On the right is the elevation with a multispectral hillshade effect. I went through a few color ramps to test which best complemented this DEM's physical features. I also went ahead and grouped many of the original land cover features into Pine Trees, Douglas Firs, etc. in order to generalize the different types of tree types. As for the map layout, at first I only had a single map frame and tested ways to represent elevation alongside land cover since I would otherwise have to make the land cover layer very transparent to notice any hillshade effects. Ultimately came to the conclusion that I needed two different map frames depicting the information I wanted.


Comments
Post a Comment