Module 10- Dot Mapping
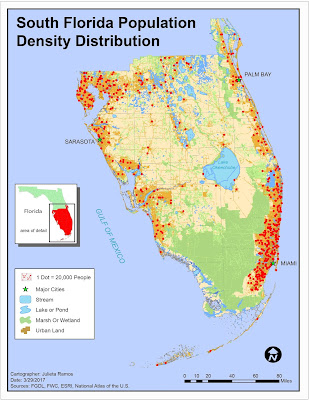
This week we covered Dot density mapping. Our assignment being to make a dot density map using tabular Census data, ArcMap, and Illustrator to finalize. The job entailed presenting population data for South Florida counties.
I did this by joining the tabular Census data to the South Florida county shape file provided and creating a new shape file out of it containing all the data necessary for this. We were also provided with an Urban Land and Surface Water shape file. I noticed there were 3 major attributes within surface water data: streams, wetlands, and lakes. They're not the same physical feature, so they were separated in order to uniquely represent each feature. Urban Land was the key feature for this assignment as it allowed to only display population density in urban areas.
I did this by joining the tabular Census data to the South Florida county shape file provided and creating a new shape file out of it containing all the data necessary for this. We were also provided with an Urban Land and Surface Water shape file. I noticed there were 3 major attributes within surface water data: streams, wetlands, and lakes. They're not the same physical feature, so they were separated in order to uniquely represent each feature. Urban Land was the key feature for this assignment as it allowed to only display population density in urban areas.


Comments
Post a Comment