Week 5 Lab- Projections Pt. 1
Purpose: To view and project data into three different projected coordinate systems in ArcMap. Then quantify the difference in area between data displayed in the three projected coordinate systems and map them in multiple data frames.
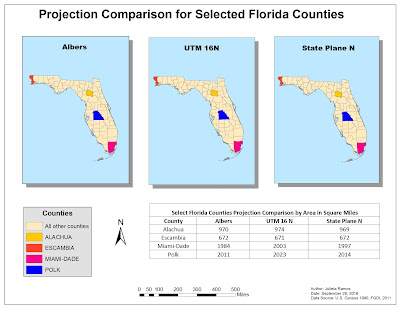
The big task this week was comprehending how Projected Coordinate Systems work, why they're important, and how they apply to a map you create. To lay this out, we worked with a single shape file for the state of Florida and modified the coordinate system using ArcToolbox. In order to view the differences in Projected Coordinate Systems, a number of counties had to be selected and highlighted in the maps using Attribute Tables for each layer. Then the area of the four counties was calculated and recorded on a table to include in the map below.
The big task this week was comprehending how Projected Coordinate Systems work, why they're important, and how they apply to a map you create. To lay this out, we worked with a single shape file for the state of Florida and modified the coordinate system using ArcToolbox. In order to view the differences in Projected Coordinate Systems, a number of counties had to be selected and highlighted in the maps using Attribute Tables for each layer. Then the area of the four counties was calculated and recorded on a table to include in the map below.


Comments
Post a Comment