GIS4035 Module 7-- Multispectral Analysis
We continued our lessons in ERDAS Imagine this week through lab exercises which taught us how to interpret histogram data of satellite images and how to identify features using said data.
By the end, I had to have identified three different features that fit the following descriptions:


By the end, I had to have identified three different features that fit the following descriptions:
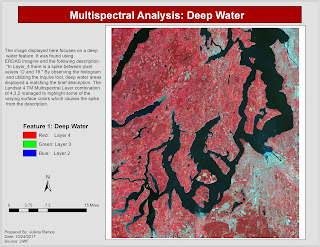
- In Layer_4 there is a spike between pixel values of 12 and 18.
- Identify the feature that represents both A) a small spike in layers 1-4 around pixel value 200, and B) a large spike between pixel values 9 and 11 in Layer_5 and Layer_6.
- In certain areas of water, layers 1-3 to become much brighter than normal, layer 4 becomes somewhat brighter, and layers 5-6 to remain unchanged.
I used the Inquire cursor for the first feature as it points to pixel values. Having analyzed the histogram, it helped determine that the feature I'm looking for would be dark in color. The only consistently dark feature was deep water.

There were two areas in the image with the brightest pixels but only one feature that reached 200 pixel value, which was snow. I darkened the vegetation surrounding it in order to better highlight this feature.

The third feature was somewhat difficult to pinpoint, but made sense in the end. While deep water remains dark in color under most bands, surface water particles will give away shallow water areas in an satellite image.


Comments
Post a Comment