GIS5935 Week 7-- TINs and DEMs
This week we explored Triangular Irregular Networks (TIN) and Digital Elevation Models (DEM) in greater detail to learn their differences, the type of applications they're typically used in, and what makes each unique when applied in a GIS analysis.
I found the lab exercises to be extremely helpful in illustrating differences. For example, when you add points to represent data points to a DEM, there will be more points as opposed to a TIN which creates a point where necessary in order to highlight the most relevant data.
I found the lab exercises to be extremely helpful in illustrating differences. For example, when you add points to represent data points to a DEM, there will be more points as opposed to a TIN which creates a point where necessary in order to highlight the most relevant data.

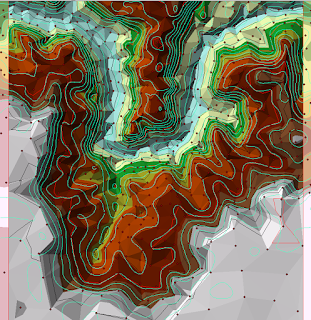
Above is an example from an exercise which I think serves to gather a better idea of how data in TINs is distributed. The aqua contours represent contours created from a Spline done on a set of Points. Black and red contours represent TIN contours.
A big difference I noticed right away was how spaced the contours created from points were in comparison to the contours from the TIN. The biggest differences appeared to be at lower elevations where the point contours are more generalized to cover more area. The smallest differences appear to be at the highest elevations. Differences can be explained through the nature of each method applied. A Spline is meant to result in a smooth surface that passes through points, hence larger gaps at lower elevations. Contours for the TIN on the other hand appear closest to points.
A big difference I noticed right away was how spaced the contours created from points were in comparison to the contours from the TIN. The biggest differences appeared to be at lower elevations where the point contours are more generalized to cover more area. The smallest differences appear to be at the highest elevations. Differences can be explained through the nature of each method applied. A Spline is meant to result in a smooth surface that passes through points, hence larger gaps at lower elevations. Contours for the TIN on the other hand appear closest to points.


Comments
Post a Comment